Willa Patterson · 25 September 2026
Tracing Water Quality Shifts Through Community-Led Sampling Efforts in Valley Streams
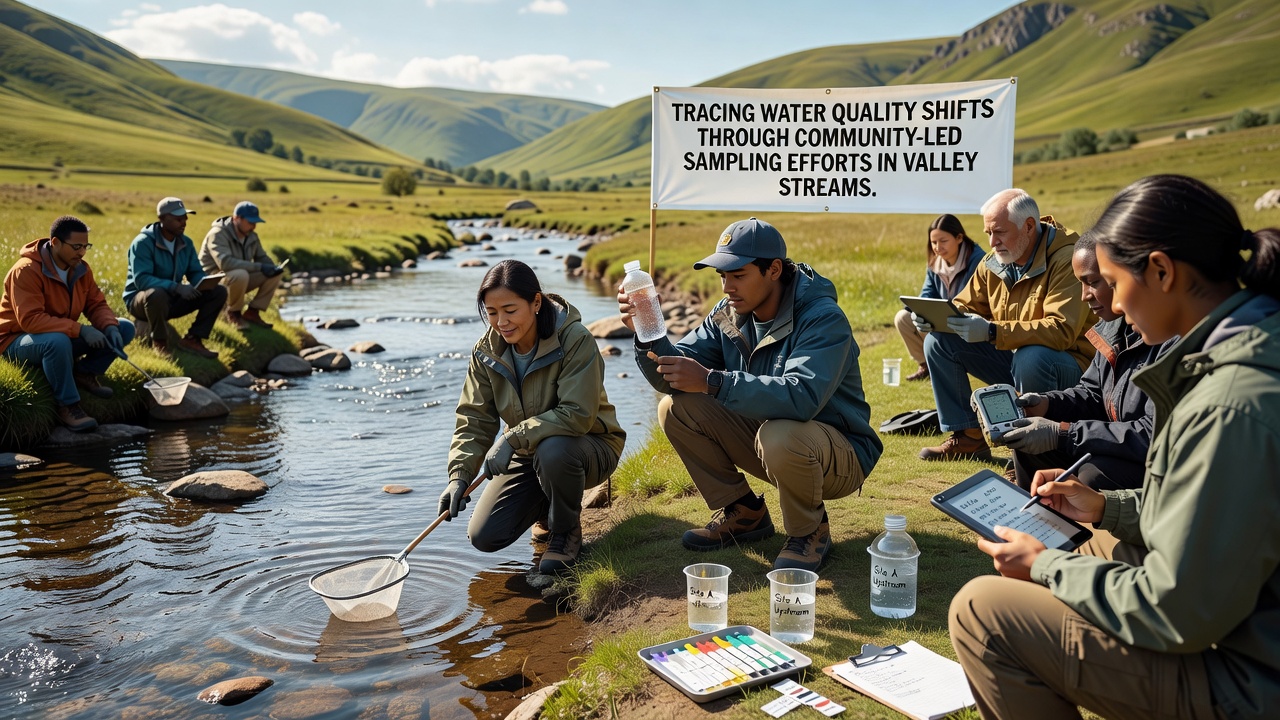
Valley streams across multiple regions have shown measurable changes in water quality parameters over the past decade, and community-led sampling programs have documented these shifts through consistent data collection at fixed sites. Local groups coordinate monthly visits to designated points along tributaries, where they measure temperature, dissolved oxygen, pH levels, turbidity, and nutrient concentrations such as nitrates and phosphates. These efforts produce time-series datasets that complement agency monitoring networks, and researchers have used the resulting records to identify seasonal patterns and longer-term trends in agricultural and suburban watersheds.
Program Structure and Data Collection Protocols
Community organizations establish sampling routes that cover headwater reaches through lower valley segments, and volunteers receive training in grab sampling techniques along with calibration of handheld meters before each outing. Protocols require duplicate readings at each location plus chain-of-custody forms for laboratory analysis of additional parameters like total suspended solids and bacterial counts. Data get uploaded to shared online platforms within 48 hours, which allows cross-checking against historical baselines maintained by state environmental departments. In September 2026, several valley networks plan synchronized sampling events timed with post-irrigation runoff periods to capture peak nutrient pulses that earlier years have linked to downstream algal blooms.
Observers note that participation rates have remained stable since programs expanded in 2019, with groups drawing from high schools, watershed associations, and retired professionals who contribute both labor and local knowledge of access points. Equipment costs stay modest because groups rely on bulk-purchased test strips supplemented by periodic professional lab verification, and grants from regional conservation districts have covered replacement sensors and data-logging software.
Documented Shifts in Key Parameters
Analysis of multi-year records reveals gradual increases in average nitrate concentrations during spring months in streams draining row-crop areas, while dissolved oxygen minima in summer have dropped by measurable amounts at several mid-valley sites. Turbidity spikes correlate with storm events more strongly in reaches with recent construction activity, and pH readings have shown slight upward trends in limestone-influenced catchments. These patterns emerge when volunteers plot monthly averages alongside precipitation data from nearby weather stations, and the combined datasets help separate natural variability from land-use influences.
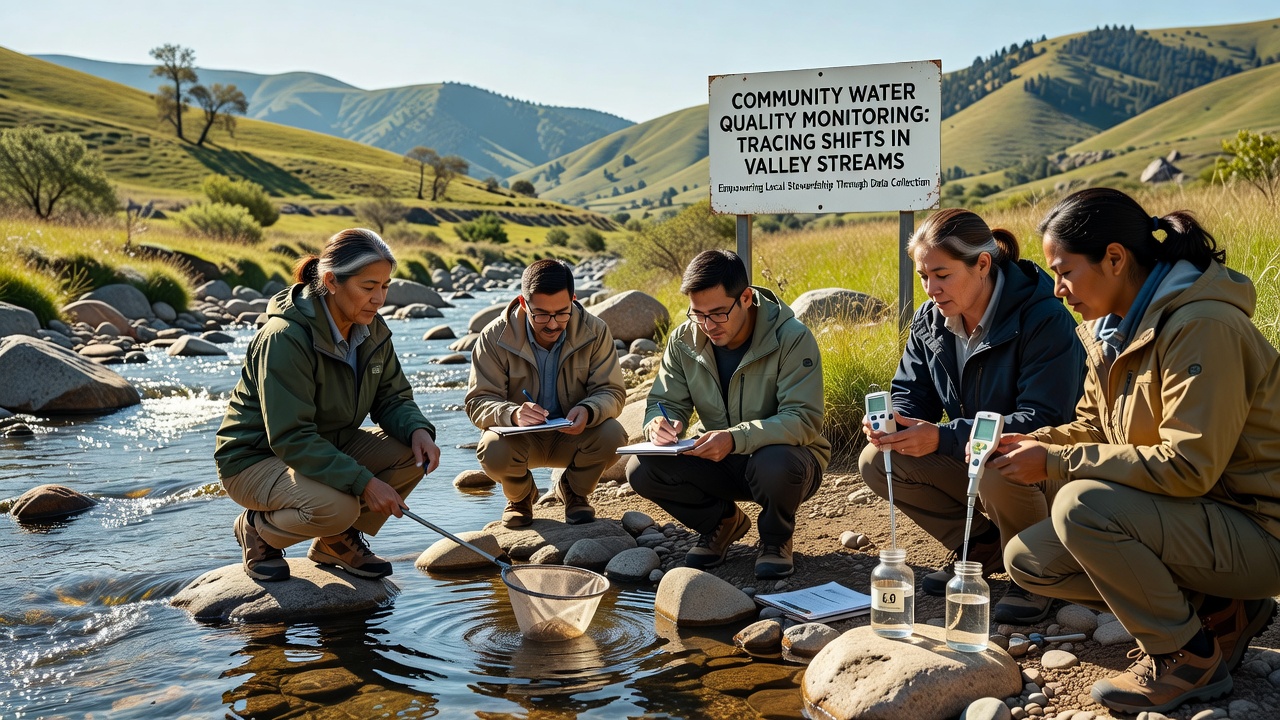
One study coordinated across three adjacent valleys found that sites with upstream riparian buffers maintained more stable oxygen levels compared with those lacking buffer protection, and the difference appeared consistently across wet and dry years. Researchers cross-referenced community data with records from the United States Geological Survey to confirm that volunteer measurements aligned within acceptable margins for trend detection. Similar programs operating in Canadian prairie streams have reported comparable nutrient patterns, which suggests the approach scales across different agricultural landscapes.
Integration with Regulatory and Research Frameworks
State agencies now incorporate community-generated datasets into biennial water quality assessments submitted under federal requirements, and several valley groups have contributed evidence used in total maximum daily load calculations for impaired segments. University researchers have partnered with these networks to deploy continuous loggers at a subset of sites, which fills gaps between volunteer visits and provides higher-resolution information during storm events. The resulting hybrid datasets support modeling efforts that predict how changes in fertilizer application timing might affect downstream concentrations.
International examples include coordinated sampling in Australian Murray-Darling basin tributaries, where citizen groups supply data to the Australian Government Department of Climate Change, Energy, the Environment and Water for basin-wide reporting. Those records have helped track salinity shifts tied to irrigation return flows, and the methods parallel techniques used in North American valley settings.
Challenges in Maintaining Long-Term Records
Volunteer turnover creates occasional gaps in coverage, yet groups mitigate this through overlapping training sessions and digital archives that allow new participants to review prior site notes. Equipment drift requires scheduled calibration checks against certified standards, and some networks have adopted redundant sensors to flag outliers before data upload. Funding cycles remain uncertain, which prompts groups to seek diversified support from local businesses and foundation grants rather than relying on single sources.
Conclusion
Community-led sampling has generated continuous records that capture water quality dynamics in valley streams at a spatial density agencies alone could not sustain. The datasets reveal measurable shifts in nutrients, oxygen, and turbidity that align with surrounding land management and seasonal hydrology. Continued coordination between volunteers, researchers, and regulators will determine how effectively these observations inform restoration priorities and regulatory decisions in coming years.